Ballot Issues
| A Better Seattle
|
| Citizens for Safe Neighborhood
|
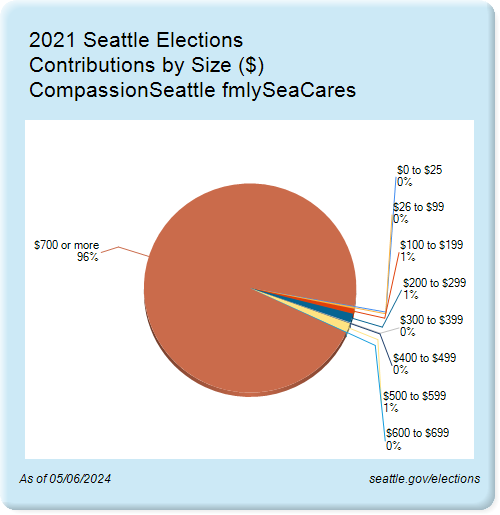
| CompassionSeattle fmlySeaCares
|
| Kshama Solidarity Campaign
|
| Real Change- HseOurNbrs BI-21
|
| Recall Jenny Durkan
|
| Recall Sawant
|
|
|
|
Please wait while chart is loaded...
|
|
$ Amount of
Contributions |
Number of
Contributors |
|
|
| |
|
Contributions |
Contributors |
|
$ |
% |
# |
% |
| |
| $0 to $25 |
$1,364 |
0.1% |
67 |
15.5% |
| $26 to $99 |
$3,172 |
0.3% |
62 |
14.4% |
| $100 to $199 |
$9,535 |
0.8% |
89 |
20.6% |
| $200 to $299 |
$16,411 |
1.4% |
68 |
15.7% |
| $300 to $399 |
$1,600 |
0.1% |
5 |
1.2% |
| $400 to $499 |
$450 |
0.0% |
1 |
0.2% |
| $500 to $599 |
$16,550 |
1.4% |
33 |
7.6% |
| $600 to $699 |
$1,200 |
0.1% |
2 |
0.5% |
| $700 or more |
$1,144,187 |
95.8% |
105 |
24.3% |
| |
| Total |
$1,194,469 |
100.0% |
432 |
100.0% |
|