Ballot Issues
| A Better Seattle
|
| Citizens for Safe Neighborhood
|
| CompassionSeattle fmlySeaCares
|
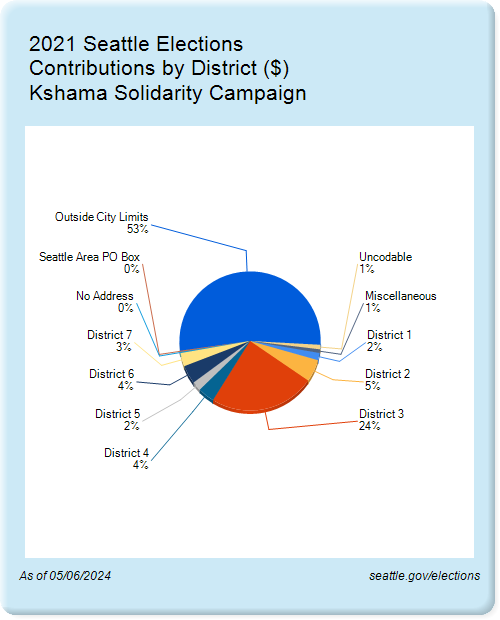
| Kshama Solidarity Campaign
|
| Real Change- HseOurNbrs BI-21
|
| Recall Jenny Durkan
|
| Recall Sawant
|
|
|
|
Please wait while chart is loaded...
|
|
$ Amount of
Contributions |
Number of
Contributors |
|
|
| |
|
Contributions |
Contributors |
|
$ |
% |
# |
% |
| |
| District 1 |
$17,841 |
1.7% |
177 |
1.5% |
| District 2 |
$54,404 |
5.2% |
468 |
4.0% |
| District 3 |
$254,305 |
24.2% |
4,738 |
40.8% |
| District 4 |
$40,501 |
3.8% |
419 |
3.6% |
| District 5 |
$22,469 |
2.1% |
206 |
1.8% |
| District 6 |
$45,553 |
4.3% |
322 |
2.8% |
| District 7 |
$32,698 |
3.1% |
523 |
4.5% |
| No Address |
$2,902 |
0.3% |
100 |
0.9% |
| Seattle Area PO Box |
$2,884 |
0.3% |
28 |
0.2% |
| Outside City Limits |
$559,205 |
53.1% |
4,332 |
37.3% |
| Uncodable |
$11,108 |
1.1% |
312 |
2.7% |
| Miscellaneous |
$8,907 |
0.8% |
0 |
0.0% |
| |
| Total |
$1,052,777 |
100.0% |
11,625 |
100.0% |
|