All Categories
| All Candidates
|
| All Ballot Issues
|
|
All Contests
| Mayor
|
| City Council Position 8
|
| City Council Position 9
|
| City Council Undesignated
|
| City Attorney
|
| 1-126 Homeless Services Levy
|
| I-127 Rental Pricing
|
| Potential New Ballot Issue
|
|
|
|
Please wait while chart is loaded...
|
|
Amount of
Contributions |
Number of
Contributors |
|
|
| |
|
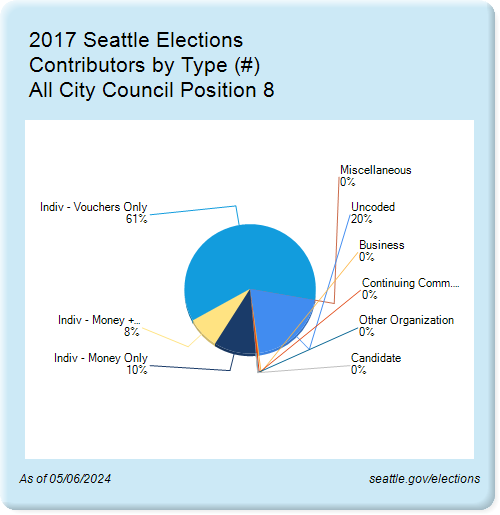
Contributors |
|
# |
% |
| |
| Uncoded |
2,496 |
20.0% |
| Business |
32 |
0.3% |
| Continuing Comm. (PAC) |
53 |
0.4% |
| Other Organization |
6 |
0.0% |
| Candidate |
7 |
0.1% |
| Indiv - Money Only |
1,286 |
10.3% |
| Indiv - Money + Vouchers |
990 |
8.0% |
| Indiv - Vouchers Only |
7,580 |
60.9% |
| Miscellaneous |
0 |
0.0% |
| |
| Total |
12,450 |
100.0% |
|