All Categories
| All Candidates
|
| All Ballot Issues
|
|
All Contests
| Mayor
|
| City Council Position 8
|
| City Council Position 9
|
| City Council Undesignated
|
| City Attorney
|
| 1-126 Homeless Services Levy
|
| I-127 Rental Pricing
|
| Potential New Ballot Issue
|
|
|
|
Please wait while chart is loaded...
|
|
Amount of
Contributions |
Number of
Contributors |
|
|
| |
|
Contributors |
|
# |
% |
| |
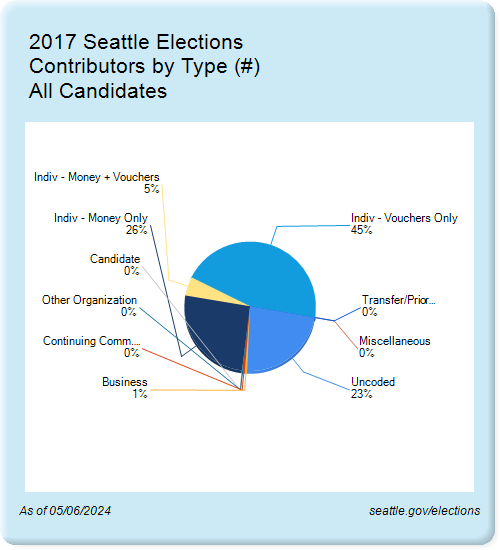
| Uncoded |
7,694 |
22.9% |
| Business |
174 |
0.5% |
| Continuing Comm. (PAC) |
158 |
0.5% |
| Other Organization |
51 |
0.2% |
| Candidate |
26 |
0.1% |
| Indiv - Money Only |
8,629 |
25.7% |
| Indiv - Money + Vouchers |
1,584 |
4.7% |
| Indiv - Vouchers Only |
15,213 |
45.4% |
| Miscellaneous |
0 |
0.0% |
| Transfer/Prior Campaign |
0 |
0.0% |
| |
| Total |
33,529 |
100.0% |
|