All Categories
| All Candidates
|
| All Ballot Issues
|
|
All Contests
| Mayor
|
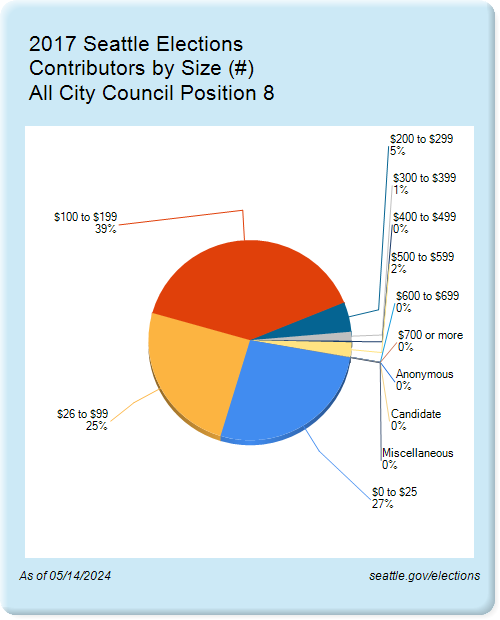
| City Council Position 8
|
| City Council Position 9
|
| City Council Undesignated
|
| City Attorney
|
| 1-126 Homeless Services Levy
|
| I-127 Rental Pricing
|
| Potential New Ballot Issue
|
|
|
|
Please wait while chart is loaded...
|
|
Amount of
Contributions |
Number of
Contributors |
|
|
| |
|
Contributions |
Contributors |
|
$ |
% |
# |
% |
| |
| $0 to $25 |
$61,935 |
5.6% |
3,353 |
26.9% |
| $26 to $99 |
$163,007 |
14.7% |
3,074 |
24.7% |
| $100 to $199 |
$510,409 |
46.1% |
4,914 |
39.5% |
| $200 to $299 |
$140,163 |
12.7% |
597 |
4.8% |
| $300 to $399 |
$59,766 |
5.4% |
179 |
1.4% |
| $400 to $499 |
$12,935 |
1.2% |
30 |
0.2% |
| $500 to $599 |
$148,500 |
13.4% |
297 |
2.4% |
| $600 to $699 |
$600 |
0.1% |
1 |
0.0% |
| $700 or more |
$2,737 |
0.2% |
1 |
0.0% |
| Anonymous |
$881 |
0.1% |
0 |
0.0% |
| Candidate |
$5,187 |
0.5% |
7 |
0.1% |
| Miscellaneous |
$1,430 |
0.1% |
0 |
0.0% |
| |
| Total |
$1,107,550 |
100.0% |
12,453 |
100.0% |
|